Phasor Representation of AC Circuits
Last week we looked at DC voltages; this week we look at AC Voltages, which take the form of sinusoids.
1 Complex Numbers and Arithmetic
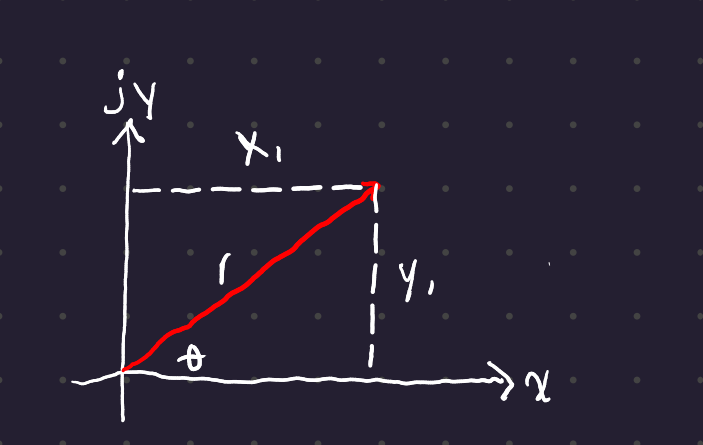
N_1 = x_1 + j\,y_1 = r\angle \theta
Also remember Euler’s Formula: e^{j\theta} = \cos{\theta} + j\sin{\theta}
To convert between the two (from a point x_1, y_1 to polar form A\angle \theta):
\begin{gather} A = \sqrt{x_1^2 + y_1^2} \\ \theta = \tan^{-1}\left(\frac{y_1}{x_1}\right) \end{gather}
Note that although generally we work in degrees in electrical engineering, formulas using ie e^{j\theta} have inputs and outputs in radians. The final answer should be in engineering notation: r \angle \theta°
The rectangular forms are convenient for addition and subtraction, but the polar forms are more convenient for multiplication and division.
\begin{gather} (x_1 + jy_1) + (x_2 + jy_2) = (x_1 + x_2) + j(y_1 + y_2) \\ (r_1 \angle \theta_1)(r_2 \angle \theta_2) = (r_1r_2)\angle(\theta_1 + \theta_2) \end{gather}
2 Phasors
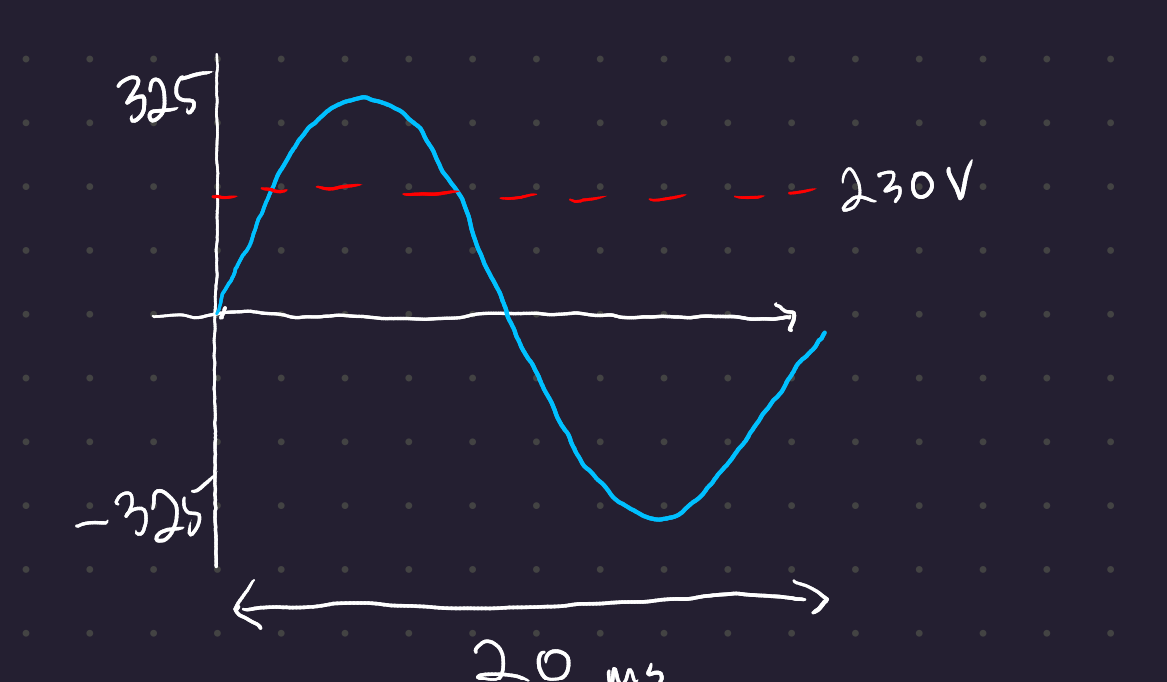
The UK power supply in a household is a single phase with peak amplitudes of \pm 325V and RMS voltage of 230V.
You could model the voltage coming into a city with an RLC circuit:


The voltage source is sinusoidal: V_M \sin (\omega t + \phi)
The current going down both paths equals the current coming out of the source: I = I_c + I_r
Ohms law: I_c = \frac{V_0}{R}
Capacitance law: $I_c = C
The voltage at the source is equal to the voltage across the inductor and the voltage across the resistor: V_M \sin (\omega t + \phi) = L\frac{dI}{dt} + V_0
This creates a second order differential equation:
V_M \sin (\omega t + \phi) = LC\frac{d^2V_0}{dt^2} + \frac{L}{R}\frac{dV0}{dt} + V_0
Kinda nasty.
2.1 Using complex numbers to represent current
Instead, we represent real signals as the real part of a complex signal e^{j\theta}
cos(\theta) = Re(e^{j\theta})
Take our voltage from earlier and represent in terms of our complex signal:
\begin{align} V \sin (\omega t + \phi) &= V \cos (\omega t + \phi - \frac{\pi}{2}) \\ &= Re(V e^{j(\omega t + \phi - \frac{\pi}{2})}) \\ &= Re(V e^{j(\omega t)} e^{\phi} e^{-j\frac{\pi}{2}}) \end{align}
This gives us our overall formula: V_M \sin (\omega t + \phi) = Re(V e^{j(\omega t)} e^{j\phi} e^{-j\frac{\pi}{2}}) \tag{1}
Don’t forget the j s in the exponents!
The complex part rotates around a circle with radius V as time t increases. The real portion of the rotating phasor corresponds to the instantaneous value of the time domain signal.
e^{j(\omega t)} is the time varying component, which marches around the unit circle.
e^{j\phi} e^{-j\frac{\pi}{2}} is a constant complex vector, and is the part of the phasor which we’re really interested in. We can also throw out the e^{-j\frac{\pi}{2}} term, since it’s always the same (sines and cosines are the same if you can choose your reference point; absolute angles are arbitrary, relative angles are important.)
So what really matters in steady state analysis is the relative difference in peak voltage V and phase angle \phi.
2.2 Phase Shift Between Phasors
Say we have two different sinusoidal voltage curves:
\begin{align} A(t) &= A_m \sin (\omega t + \phi_A) \\ B(t) &= B_m \sin (\omega t + \phi_B) \\ \end{align}
Then our two phasors are
\begin{align} \textbf{A} &= A_m\angle \phi_A \\ \textbf{B} &= B_m\angle \phi_B \\ \end{align}
3 Drawing phasor diagrams
Since we only care about steady state values, we usually set one phasor to be the reference phasor lying along the real axis.

3.1 Phasor arithmetic
It often happens in EE that you have phasors offset from each other by 90°, in which case you can simply multiply by j or -j.
If you have a voltage that is the sum of several other sinusoidal signals (of the same frequency), its phasor representation is given by the sum of the phasors that represent each component sinusoid.
This also holds for subtraction, multiplication and division.
3.2 Example phasor diagram
For this circuit:
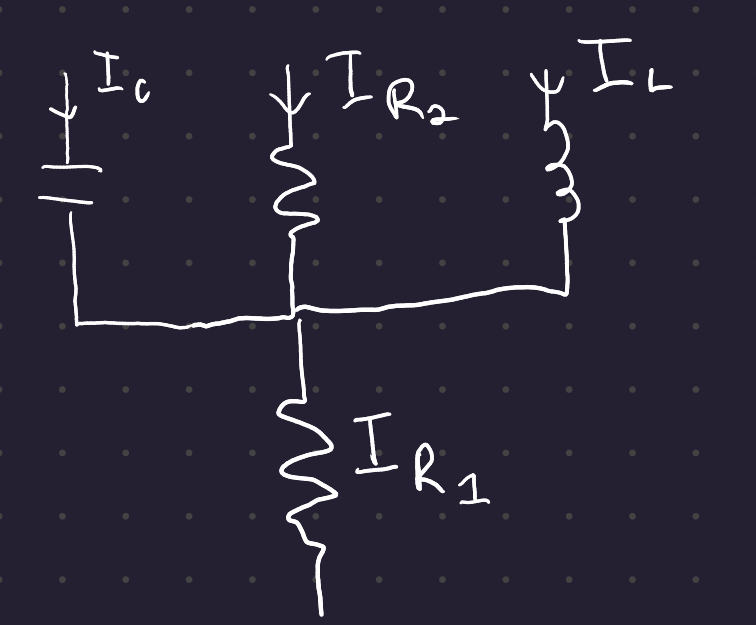
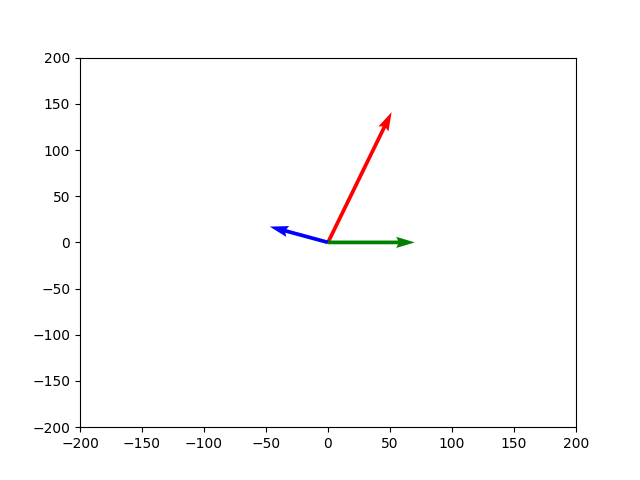
We could draw the following fictional phasor diagram:
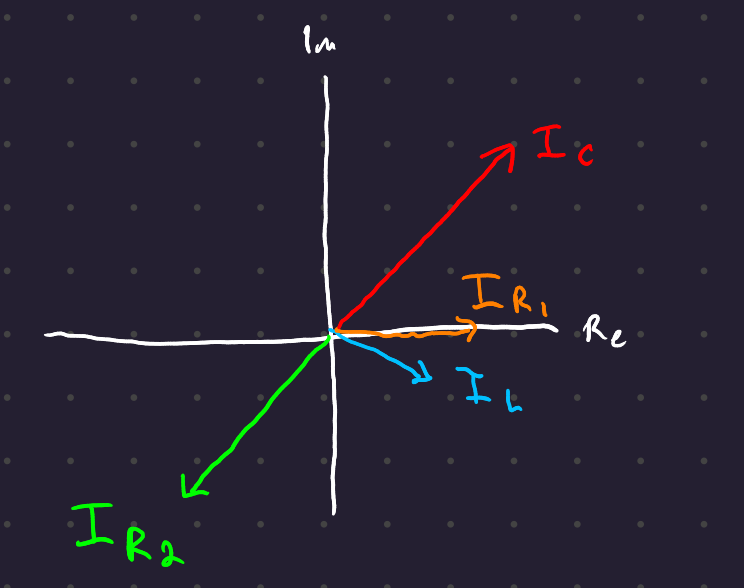
By Kirchoff’s Current law, I_C + I_{R_2} + I_L = I_{R_1}, which we can draw with vector addition:
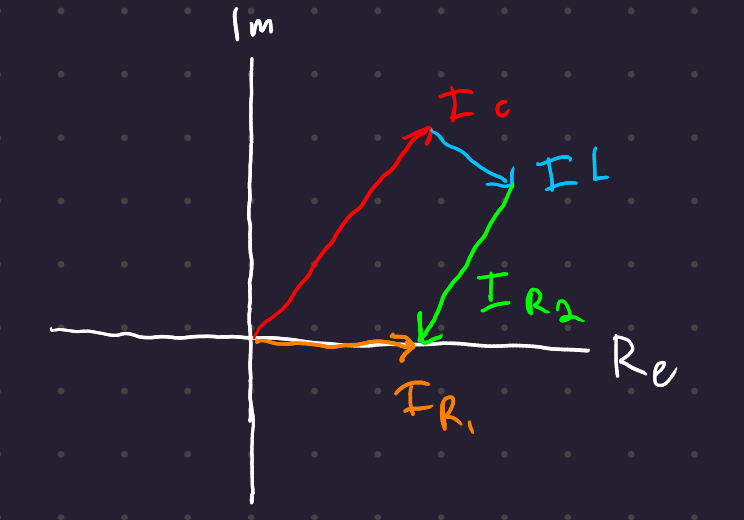
Phasor analysis is only applicable to systems at a constant frequency that approach a steady state. They are not useful for dynamic (nonlinear) systems!
3.3 A Second Example
We start with three sinusoidal signals:
\begin{gather} A = 150 \angle 30° \\ B = 70 \angle -40° \\ C = 50 \angle 120° \\ \end{gather}
We’re going to use B as our reference phasor, so the first step is to get all angles relative to B:
\begin{gather} A = 150 \angle 70° \\ B = 70 \angle 0° \\ C = 50 \angle 160° \\ \end{gather}
Now we graph:
