F2 Lab: Bernoulli I
Abstract:
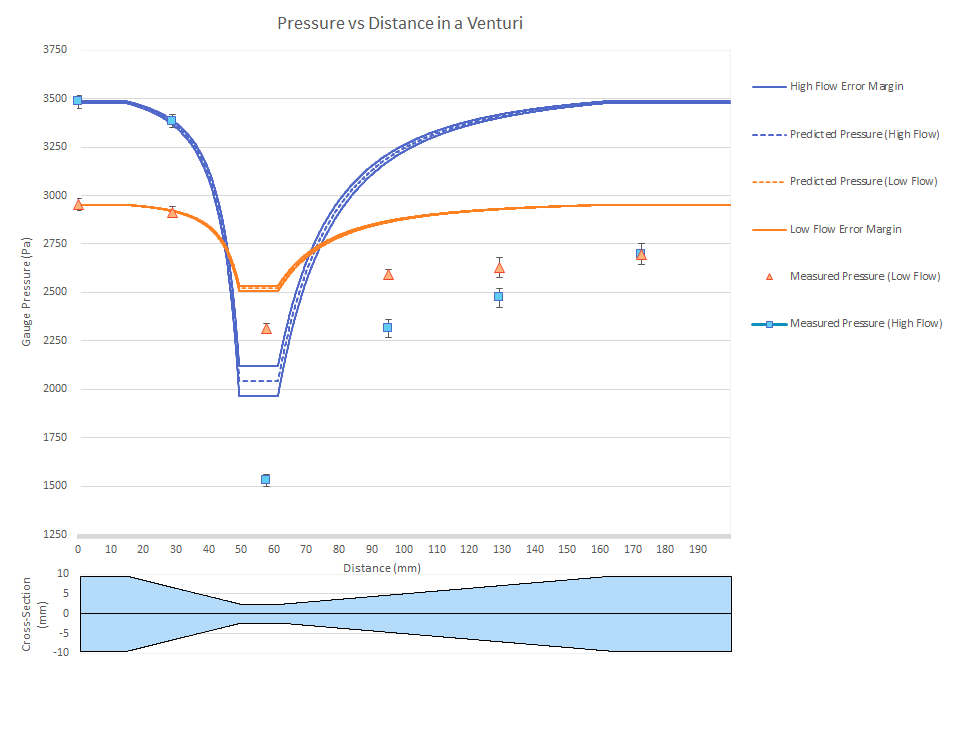
Because the analysis performed exceeds the strict requirements of the lab, a short abstract is included. The complete geometry of the venturi tube was derived from the description in the lab briefing, and the cross section was described as a piecewise function of length. From this piecewise function and the Bernoulli equation, an analytic prediction of pressure over the length of the venturi tube was described and plotted, then compared with the gathered data. The error bars on the measured data were then increased by a factor of 2 for visibility.

Conclusions:
Because flowing water obeys the continuity equation, its velocity must increase when the cross section of a pipe decreases. The Bernoulli equation for pressure in an ideal fluid predicts that this increase in velocity will be accompanied by a corresponding decrease in static pressure in sections of constricted flow. The pressure variation in a converging-diverging tube was measured and compared to an analytic prediction of pressure using the Bernoulli equation. In the converging section of the pipe, the gauge pressure was within a margin of 1% of the predicted pressure, well within the bounds of experimental error. Beyond the converging section, however, the measured gauge pressure was below the predicted pressure by a range of 20-30%. This discrepancy was likely caused by energy loss created by viscous friction within the venturi tube, and by separation from the walls caused by the inertia of fluid particles at the end of the converging section leading to pockets of turbulent flow downstream of the orifice.
There was a greater discrepancy between measured and predicted gauge pressure downstream of the converging section of the venturi tube for the higher flow rate. The higher flow rate varied from prediction by as much as 30%, whereas the lower flow rate section agreed with the prediction to within 10%. Since the higher flow rate experiences greater inertial forces, we would expect pressure drops caused by flow separation to be more extreme with a higher flow rate, leading to greater deviation from prediction. This expectation was borne out by the data.